Add clusters to Portworx Central on-premises
After installing Portworx Central, you can add the clusters you want to manage.
Prerequisites
Ensure you meet the following prerequisites on the cluster you add to Portworx Central on-premises:
Open ports on your cluster:
Port Component Purpose Incoming/Outgoing 31240 Portworx Central Sends metrics data to Portworx Central on-prem Outgoing You must be an administrator or have permissions to create and configure
Clusterrole,Clusterrolebindingobjects on your cluster. If you do not meet this prerequisite, you can still add your cluster to Portworx Central, but you cannot use the Lighthouse (Prometheus/Grafana) monitoring features.
Add a cluster to Portworx Central on-premises
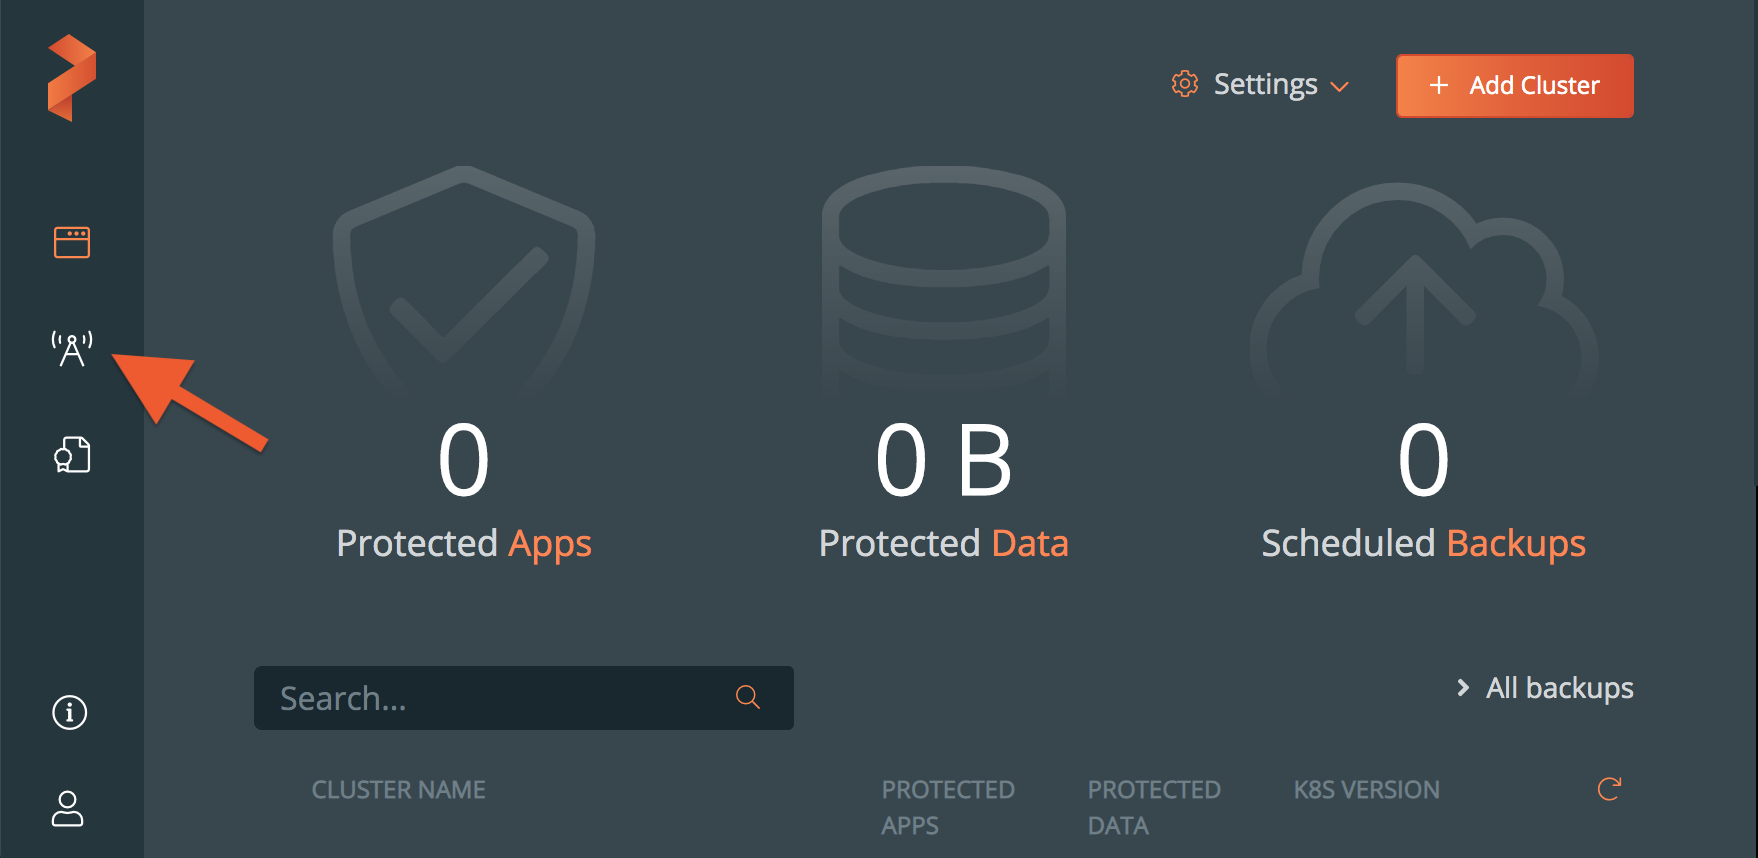
From the PX-Central home page, select the Lighthouse icon.
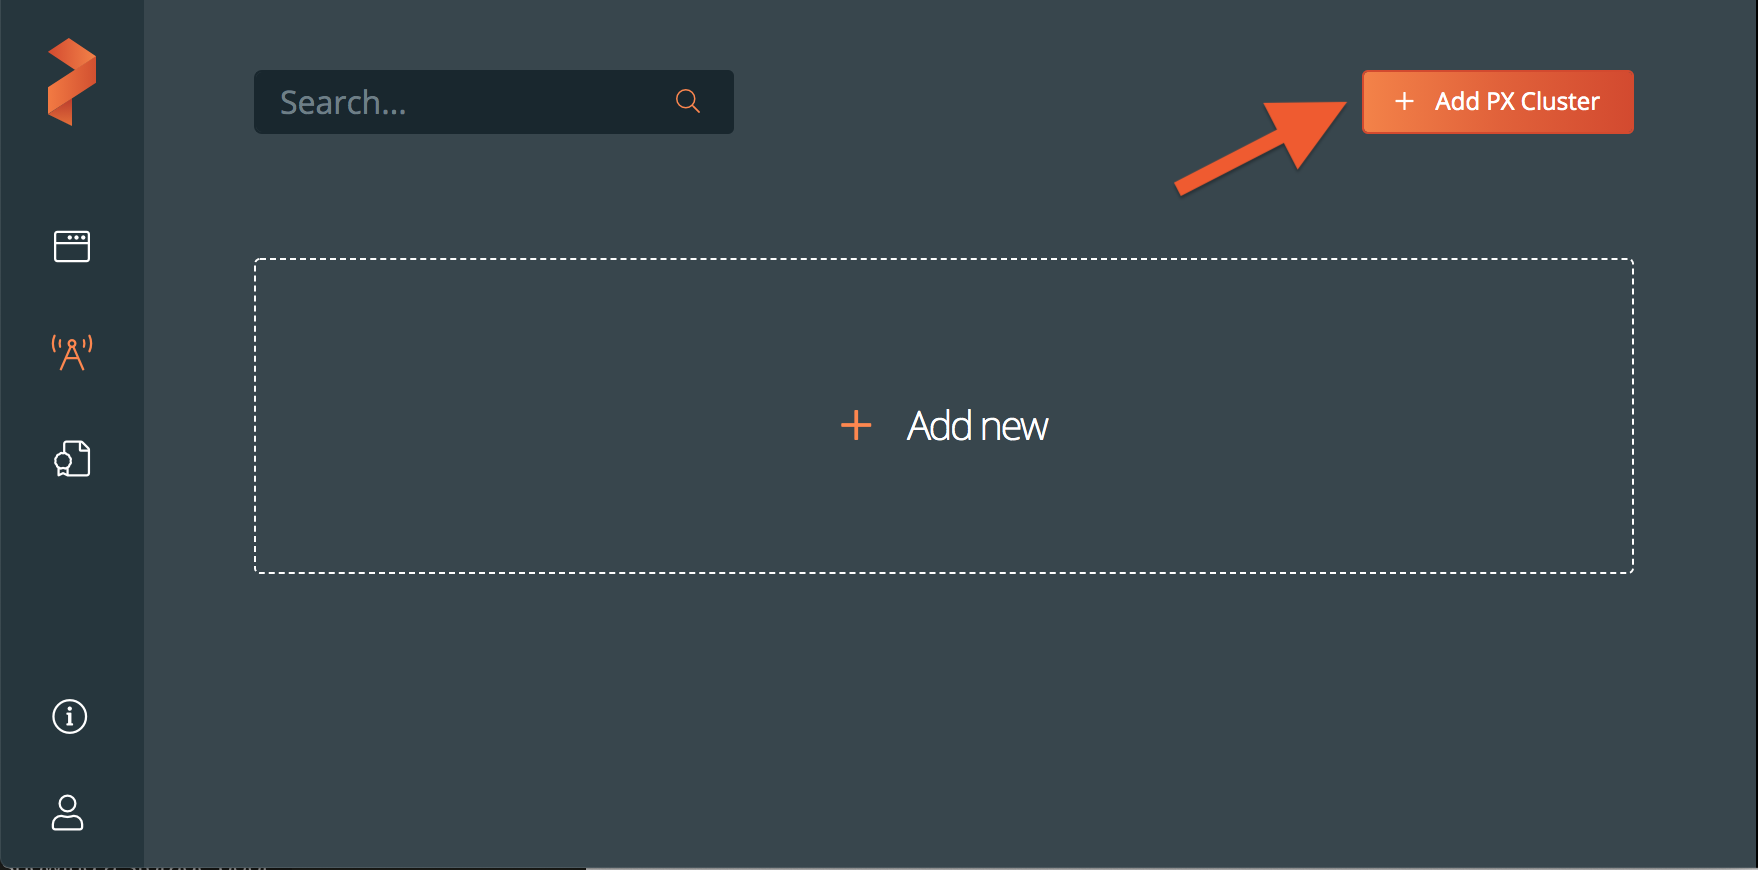
Select the Add PX Cluster button.
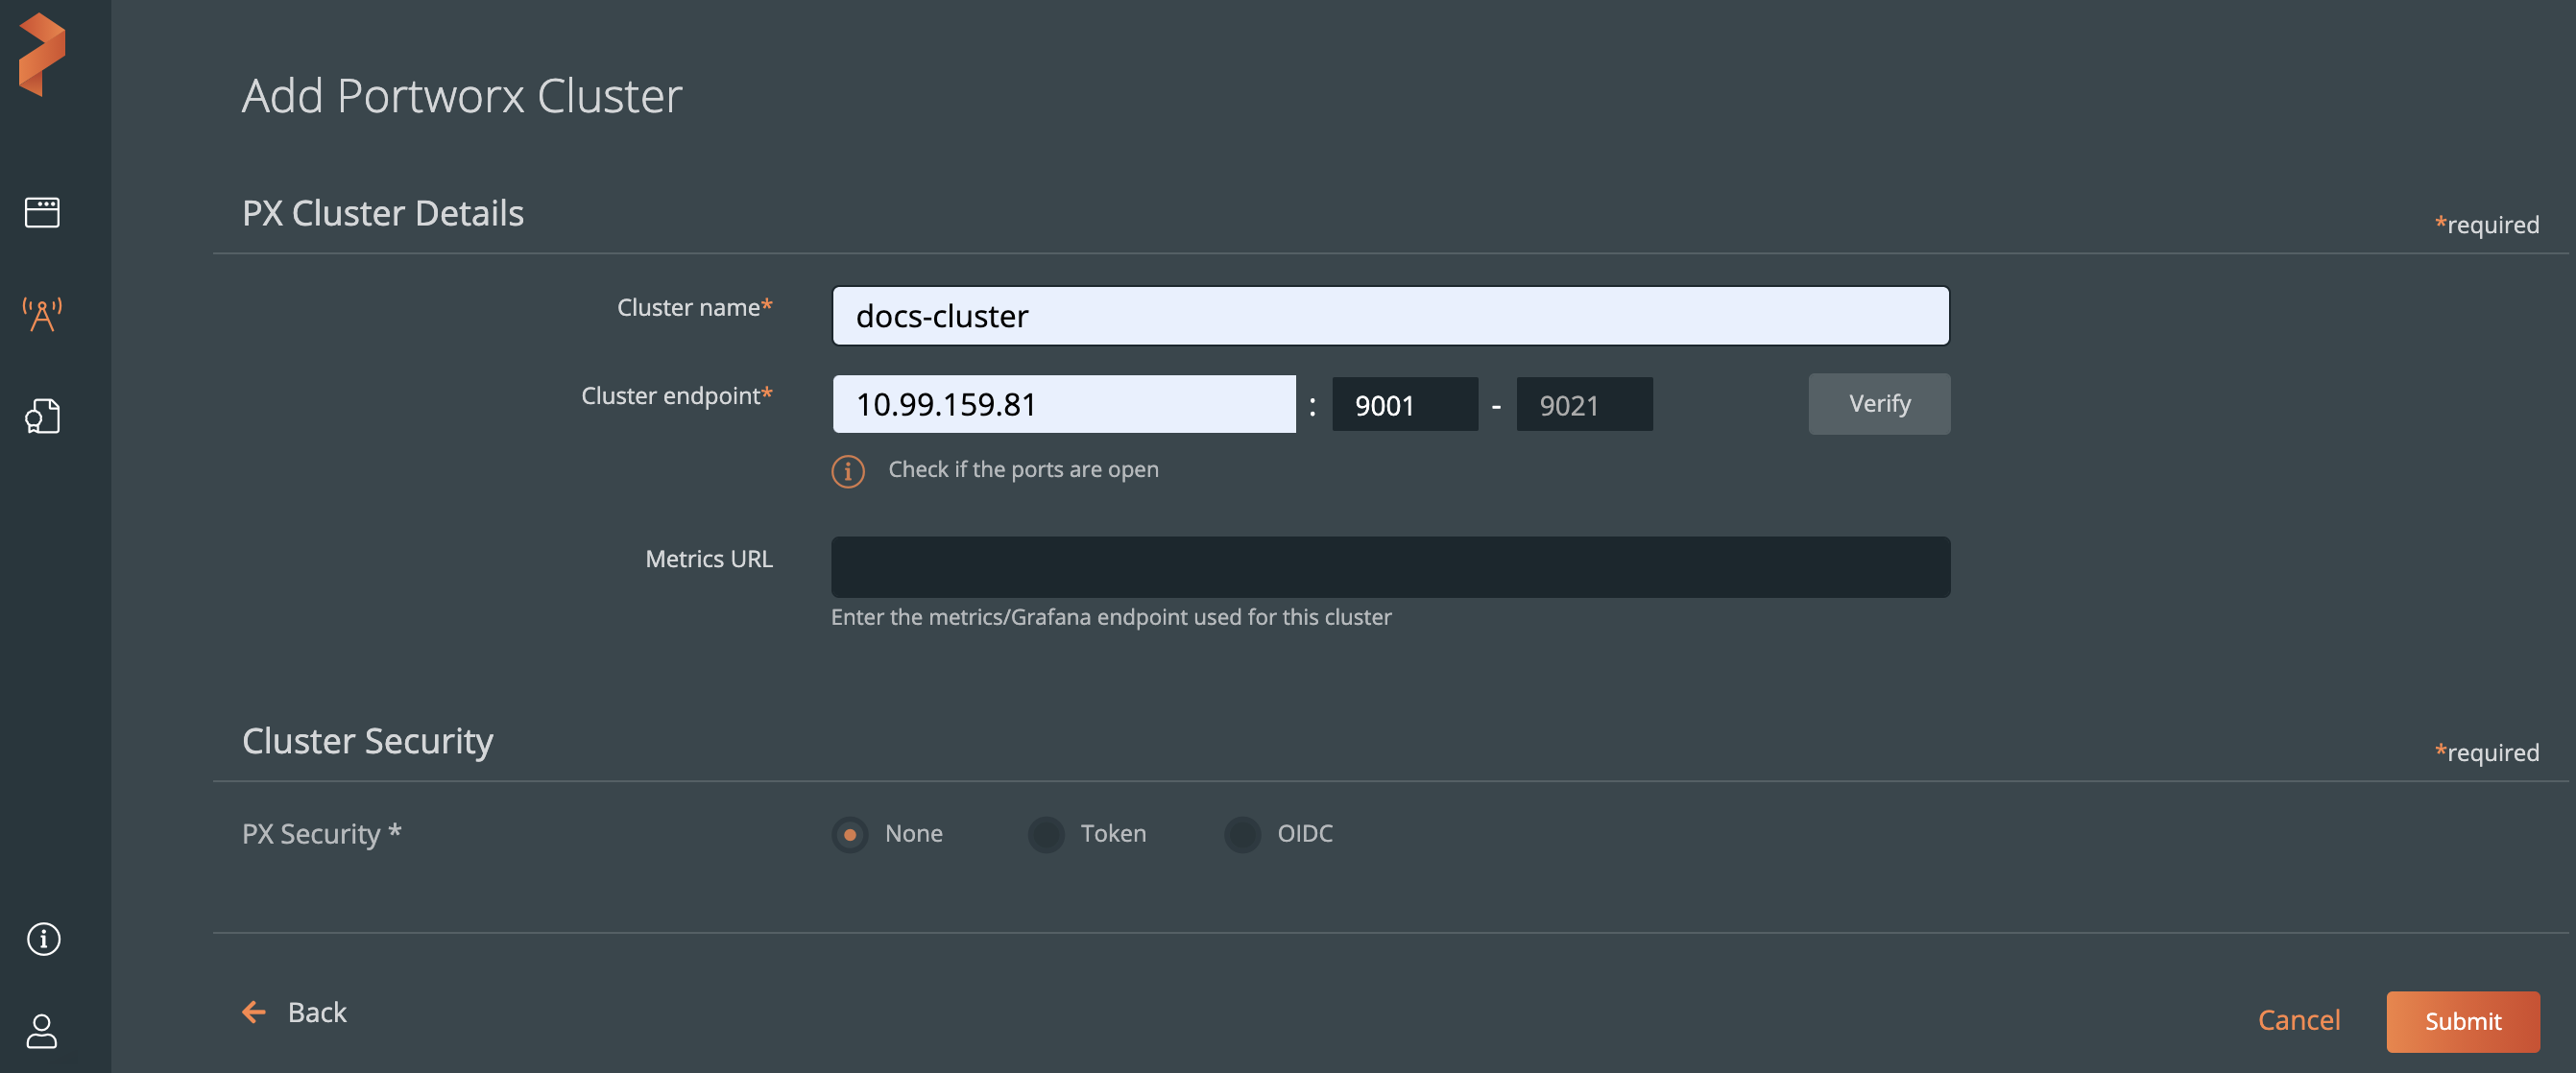
Populate the fields in the Add Portworx Cluster page:
- Enter a descriptive cluster name
NOTE: It is recommended that your cluster name is similar to the Portworx cluster name. To know the Portworx cluster name, run the
pxctl statuscommand from one of the nodes where you installed Portworx. - In the Cluster endpoint field, specify the IP address of a worker node, and the port range. If you modify the default port range, you can select the Verify button to validate that the Portworx cluster is reachable from your Lighthouse cluster.
(Optional) In the Metrics URL field, specify your Grafana endpoint:
Select the Enable metrics check box, if you want to enable metrics.
If you enable metrics, then you must paste the kubeconfig file of the cluster in the Kubeconfig text box under the K8s Cluster Details section:
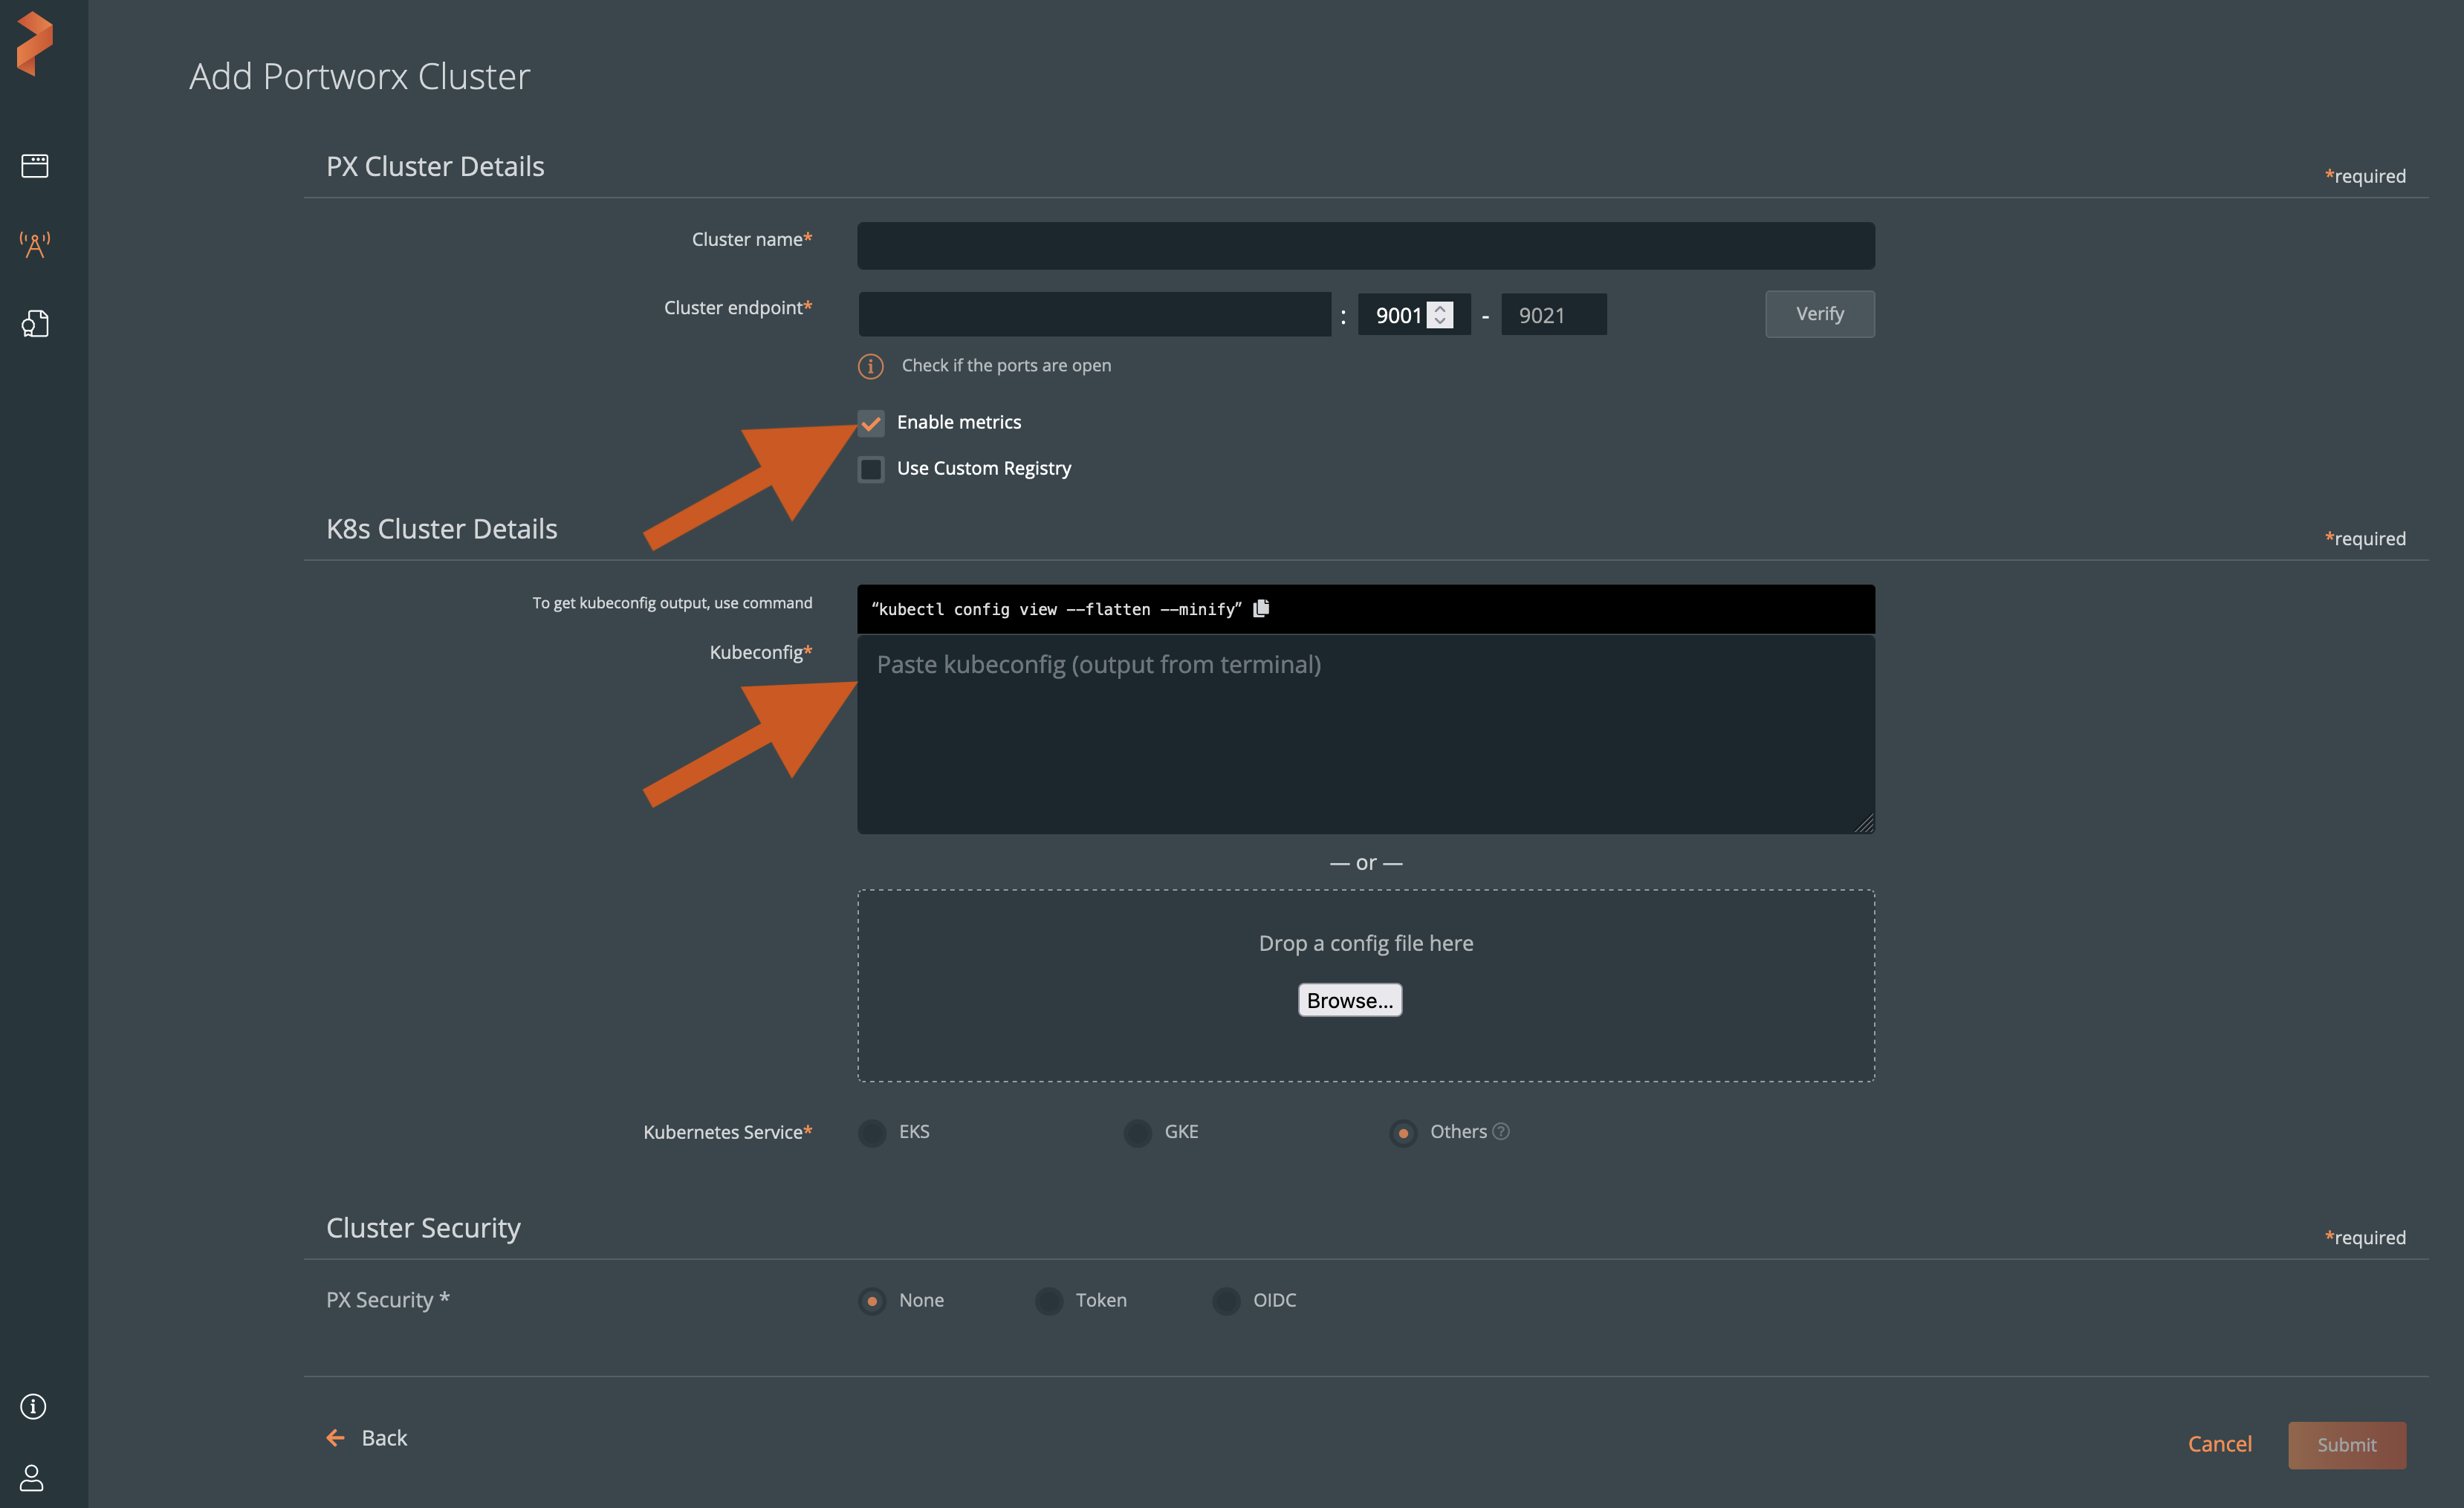
From the Kubernetes Service options, choose the EKS or GKE cluster cloud service provider. By default, Others is enabled.
From the Cluster Security section, choose one of the following PX-Security options:
- None: Security is not enabled on the PX Cluster Portworx is not setup for PX-Security (or) PX-Security is not enabled.
- Token: Choose this option when you have an OIDC token to enable PX-Security by accessing the secure Portworx cluster using a non-native Portworx Central OIDC.
- OIDC: Choose this option when you want to use the Portworx Central OIDC server to generate an OIDC token using the Portworx Central UI. Use the native Portworx Central OIDC to request a token to access this Portworx cluster. This assumes that you set up Portworx for PX-Security using native Portworx Central OIDC.
- Click the Submit button.
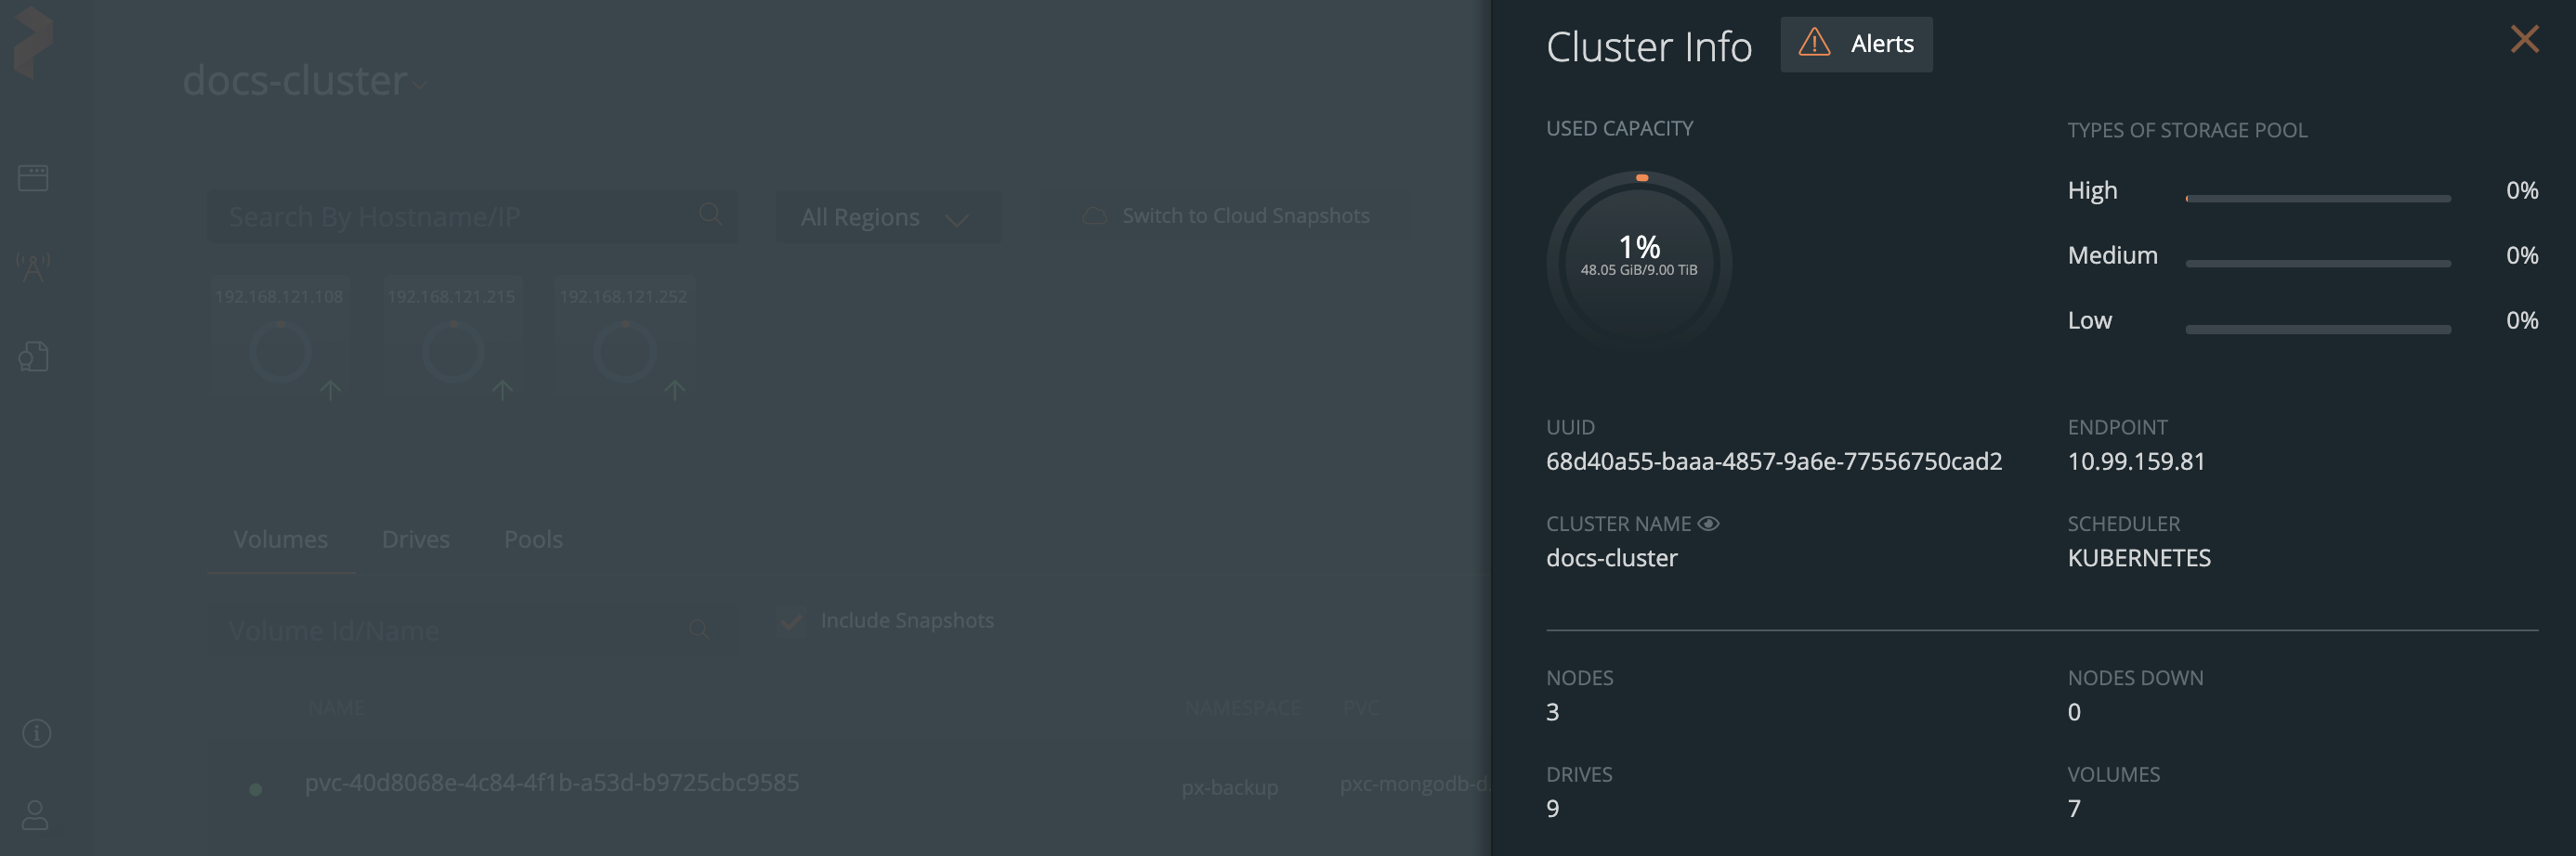
To view the cluster details:
From the Lighthouse landing page, select a cluster.
From the cluster details page, select Cluster settings dropdown list -> Cluster Info.
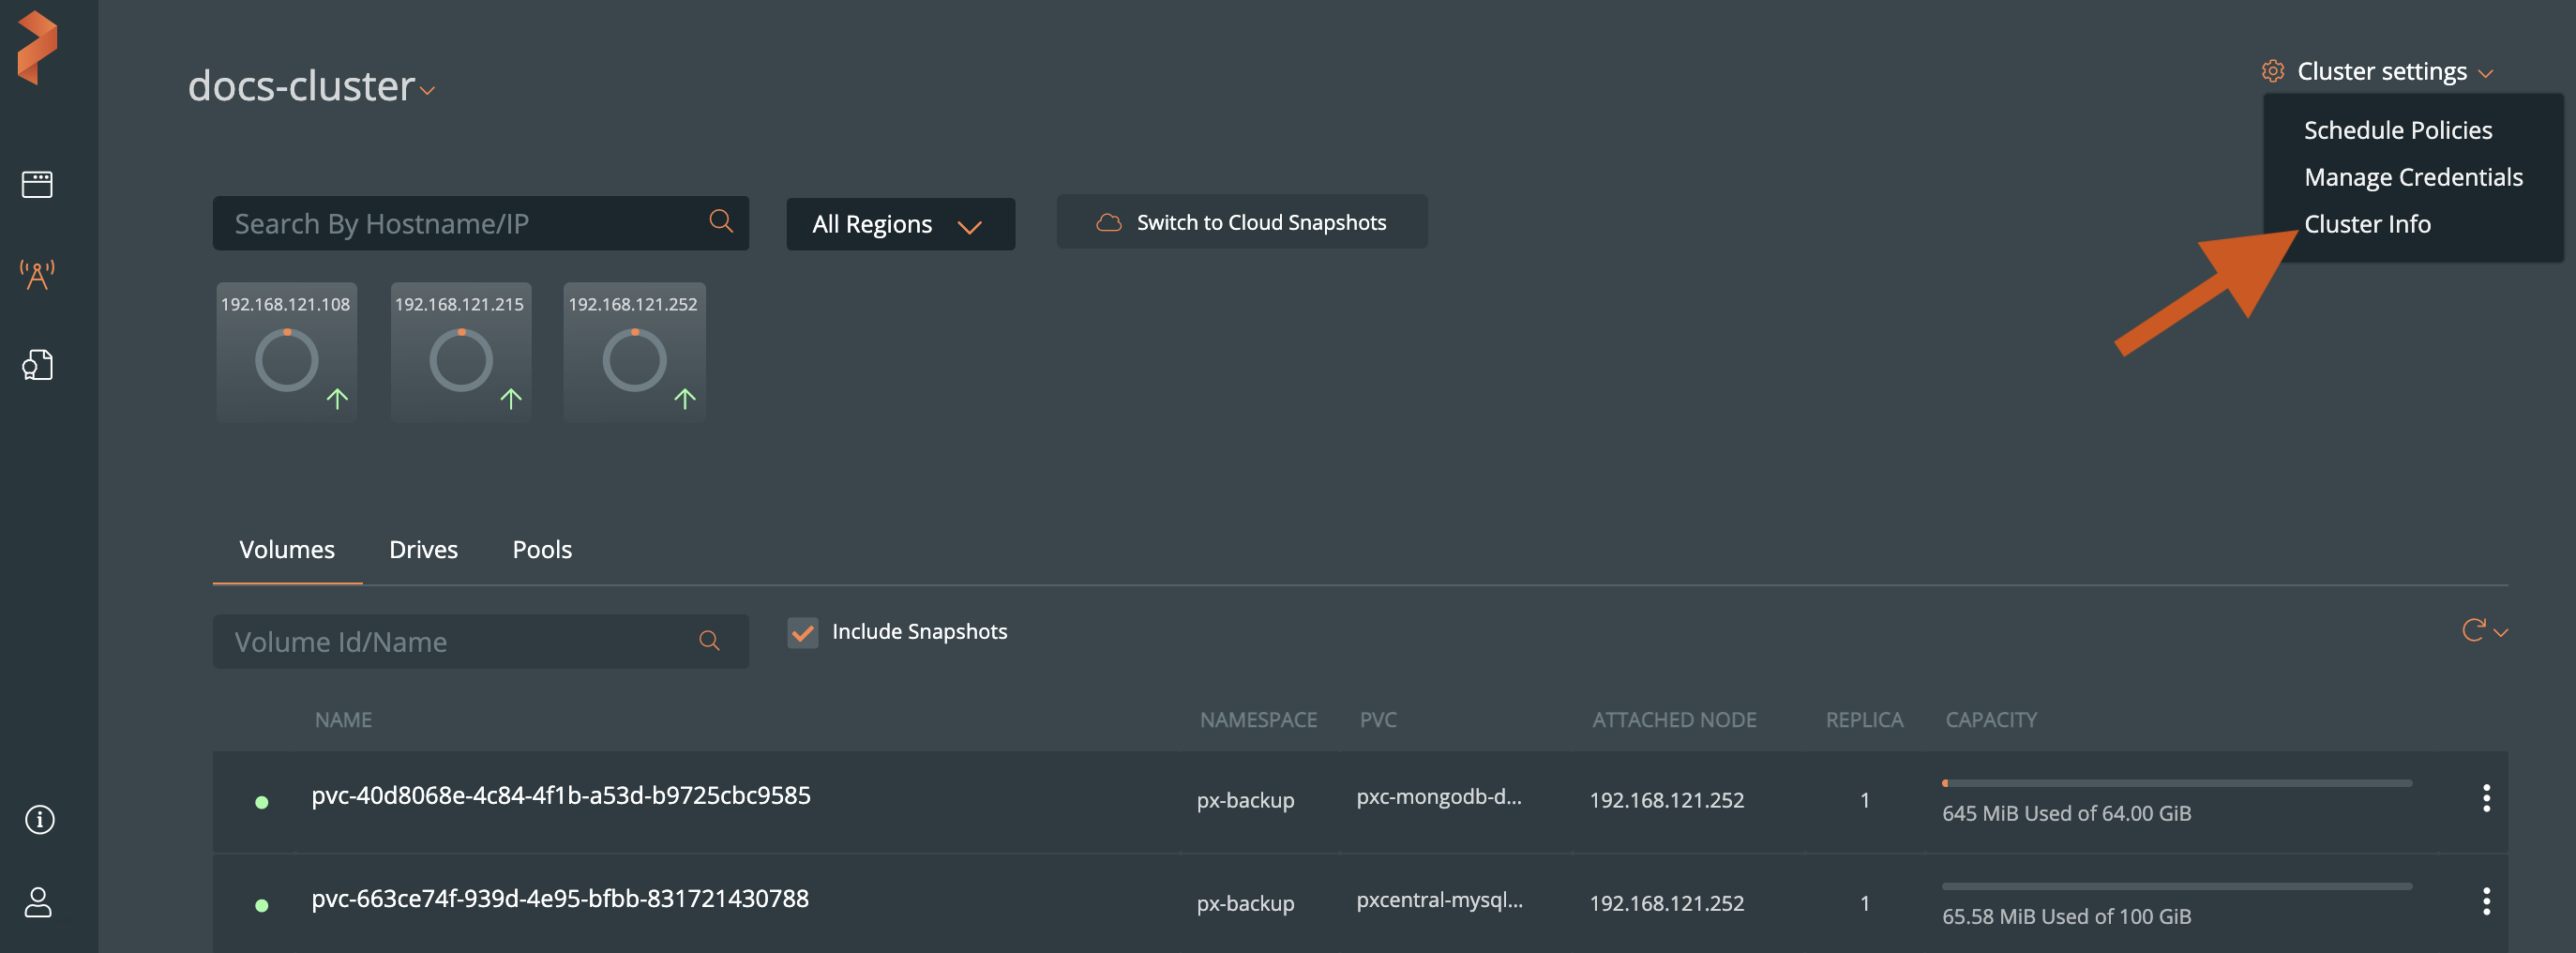
The Cluster Info window displays information such as cluster name, its used capacity, number of nodes in a cluster, and so on: